Octave analysis is often used to evaluate vibration and sound.
In this trivia,This is an easy-to-understand explanation of octaves and what octave analysis is using them.
What is octave?
You have probably heard the term "octave" in music talk.
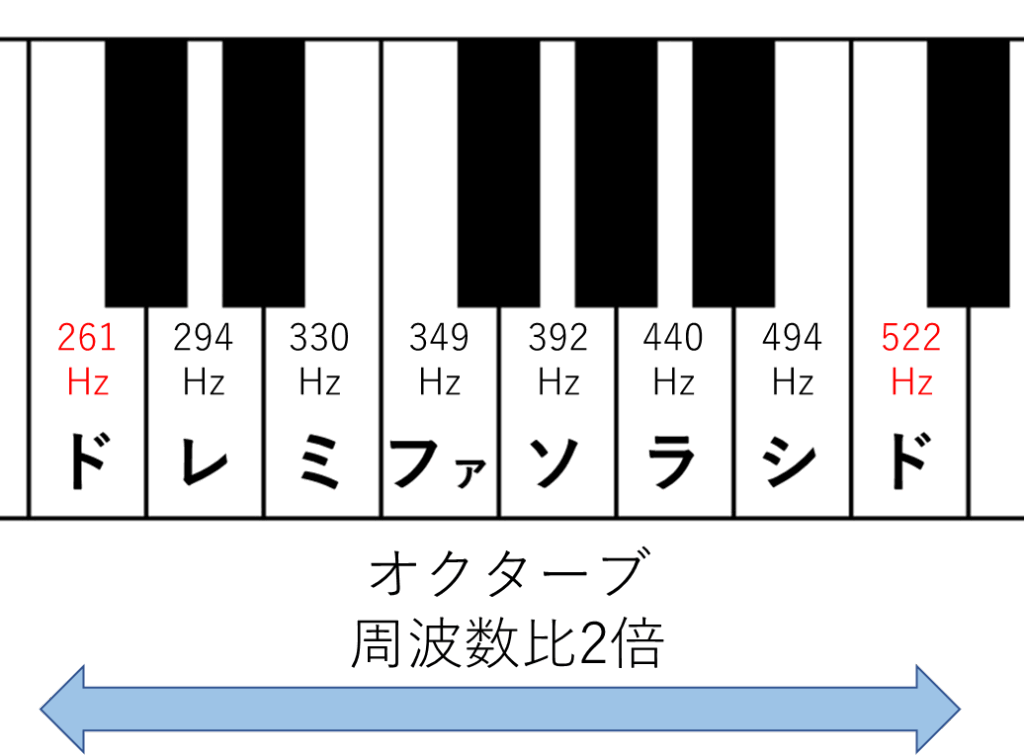
In Western music, eight intervals from a low do to the next high do are called an octave.
The first Do is about 261 Hz (261 vibrations per second) and the next Do is about 522 Hz, and the relationship between these two notes is called an octave.
What is Octave Analysis?
Basics of Octave Analysis
Octave analysis is a method of analyzing the magnitude of each frequency of sound or vibration.
The sounds we hear in everyday life are made up of a mixture of various frequency components.
Octave analysis divides these sounds into frequency bands per octave.
For example, 63Hz, 125Hz, 250Hz...etc. are examined by dividing them into bands with center frequencies that differ by a factor of 2.
This allows for a more detailed understanding of the frequency response of sound and vibration.
Why analyze by frequency band?
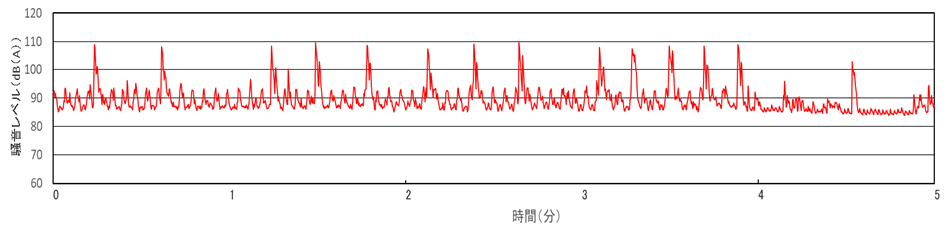
In the general sound evaluation used in noise control laws, etc., an all-pass sound synthesis of all frequencies is used.Noise Level(sound pressure level corrected for the sensation of the human ear) (Figure 2).
This data is useful for identifying trends in noise maximums, timing of occurrence, and intervals.
While it is sufficient to evaluate the audible loudness of a sound, it is necessary to know which frequencies are louder when considering noise reduction measures.
For example, if the sound is loud at low frequencies but measures are taken for high frequencies, the effect will be limited.
Frequency-by-frequency analysis, such as octave-band analysis, is effective in order to tailor countermeasures to the frequency band in question.
What octave band analysis can do
Similar to time history analysis, octave analysis allows you to analyze the maximum, minimum, average or time rate noise level (a method of arranging the noise levels during the measurement time in order of loudness to see what percentage of the total the loudness corresponds to) for each octave band.
This allows us to determine which frequencies are louder and to take optimal noise control measures.
Octave band range
Center frequency in vibration and sound
Typical center frequencies used in octave analysis are 31.5 Hz, 63 Hz, 125 Hz ... 8 kHz for sound and 1 Hz, 2 Hz, 4 Hz ... 125 Hz for vibration.
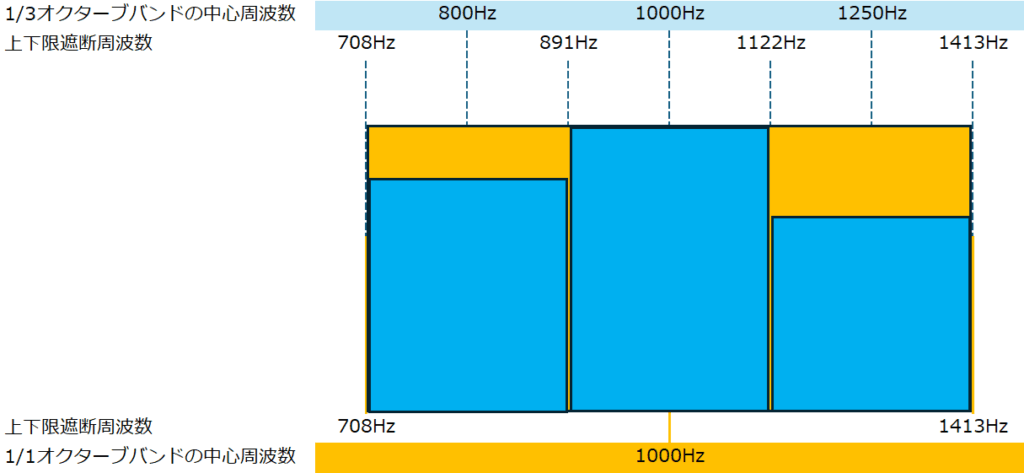
The "center frequency" refers to the middle value of that band, which actually has a width (band) that includes the center frequency.
For example, 1000 Hz includes sounds from the lower frequency limit of 710 Hz to the upper frequency limit of 1400 Hz.
The next band, 2000 Hz, covers all frequencies from the lower limit of 1400 Hz to the upper limit of 2800 Hz, so that the bands do not overlap.
The higher the center frequency, the wider the bandwidth.
1/1 octave and 1/3 octave
The octave of octave band analysis is1/1 octave bandrefers to
For a more detailed and separate analysis, use the1/3 octave band analysisfor the following reasons.
Vibration analysis, especially 1/3-octave band analysis, is often used.
Table 1 Relationship between 1/1-octave band and 1/3-octave band
| 1/1 octave band | 1/3 octave band | 1/1 octave band | 1/3 octave band | ||||
| center frequency [Hz]. | bandwidth [Hz]. | center frequency [Hz]. | bandwidth [Hz]. | center frequency [Hz]. | bandwidth [Hz]. | center frequency [Hz]. | bandwidth [Hz]. |
| 1 | 0.71~1.41 | 0.8 | 0.71~0.89 | 125 | 89.1~178 | 100 | 89.1-112 |
| 1 | 0.89 to 1.12 | 125 | 112~141 | ||||
| 1.25 | 1.12~1.41 | 160 | 141~178 | ||||
| 2 | 1.41~2.82 | 1.6 | 1.41~1.78 | 250 | 178~355 | 200 | 178~224 |
| 2 | 1.78~2.24 | 250 | 224~282 | ||||
| 2.5 | 2.24~2.82 | 315 | 282~355 | ||||
| 4 | 2.82~5.62 | 3.15 | 2.82~3.55 | 500 | 355~708 | 400 | 355~447 |
| 4 | 3.55~4.47 | 500 | 447~562 | ||||
| 5 | 4.47~5.62 | 630 | 562~708 | ||||
| 8 | 5.62~11.2 | 6.3 | 5.62~7.08 | 1000 | 708~1413 | 800 | 708~891 |
| 8 | 7.08~8.91 | 1000 | 891~1122 | ||||
| 10 | 8.91~11.2 | 1250 | 1122~1413 | ||||
| 16 | 11.2~22.4 | 12.5 | 11.2~14.1 | 2000 | 1413~2818 | 1600 | 1413~1778 |
| 16 | 14.1~17.8 | 2000 | 1778~2239 | ||||
| 20 | 17.8~22.4 | 2500 | 2239~2818 | ||||
| 31.5 | 22.4~44.7 | 25 | 22.4~28.2 | 4000 | 2818~5623 | 3150 | 2818~3548 |
| 31.5 | 28.2~35.5 | 4000 | 3548~4467 | ||||
| 40 | 35.5~44.7 | 5000 | 4467~5623 | ||||
| 63 | 44.7~89.1 | 50 | 44.7~56.2 | 8000 | 5623~11220 | 6300 | 5623~7080 |
| 63 | 56.2~70.8 | 8000 | 7080~8913 | ||||
| 80 | 70.8~89.1 | 10000 | 8913~11220 | ||||
JIS Regulations.
JIS C 1513-1:2020 "Electroacoustics - Octave band and 1/N octave band filters (analyzers) - Part 1: Specifications" specifies the center frequency and lower and upper frequency limits of 1/1 octave band as follows
- Center frequency: fm
- Lower limit frequency: fm / √(103/10)
- Upper frequency: fm × √(103/10)
The center frequency of the 1/3 octave band has the following relationship to the lower and upper frequency limits
- Center frequency: fm
- Lower limit frequency: fm / 6√(103/10)
- Upper frequency: fm ×x-mark (used to indicate an incorrect answer in a test, etc.) 6√(103/10)
Examples of measures using octave analysis
Here are some examples of noise control using octave analysis.
The subject is a specific factory, which is a factory with machinery that generates loud noises.
The noise level at this plant is regulated at the site boundary by the Noise Regulation Law.
The regulatory standard is particularly strict at night, and we found that the current standard is 61 dBA, which exceeds the nighttime regulatory limit of 50 dBA.
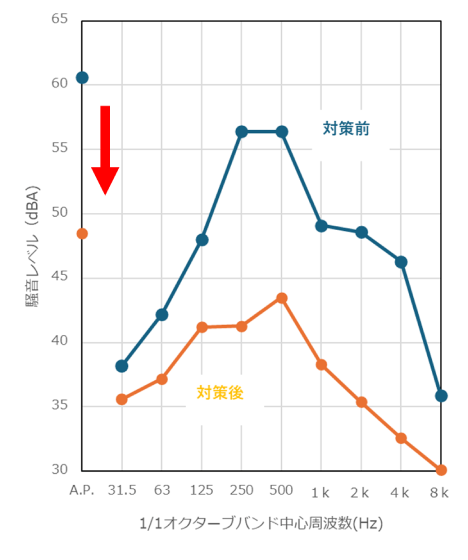
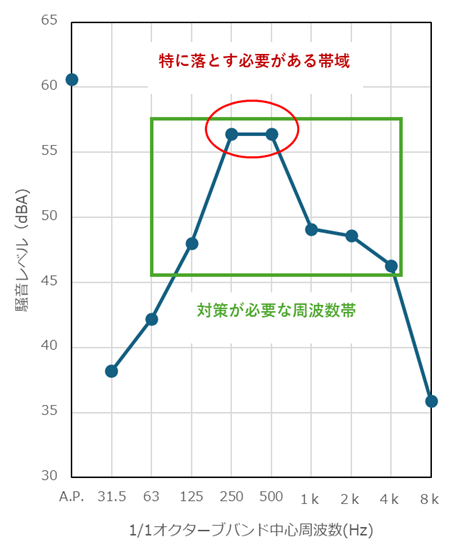
Results of octave band analysis
Octave band analysis revealed that the sound was louder in the 125 Hz to 4 kHz band, especially at 250 Hz and 500 Hz.
It is now clear that the sound in this band must be significantly reduced to below the regulatory limit of 50 dBA (see Figure 3).
Soundproofing measures implemented
The following measures were taken as countermeasures.
- Repositioning of sound sources in the building
- Vibration isolation of equipment to suppress solid sound propagation
This has reduced the noise level at the site boundary from 61 dBA to 49 dBA, allowing the plant to operate at night in compliance with regulations (see Figure 4).